Introduction:
Clustering methods have gained a lot of attention these years with its powerful strength in customer segmentation or even image classification.
In the past I utilized Python and TensorFlow to classify Street View House Numbers and applied 7 layers neural networks to achieve 90.4% validation accuracy. Details could be found via link.
The MNIST dataset contains around 60,000 handwritten digits (0-9) for training and 10,000 for testing. Similar to the Street View House Numbers (SVHN) Dataset, the MNIST dataset is used for image classification test.
This page is a comparison among popular clustering methods including KMeans, PCA, LDA and TSNE on the MNIST dataset.
With tons of online materials explaining KMeans, PCA, LDA, t-SNE, indepth discussion wouldn't be included here.
Procedure:
- Data Download: Many websites offer the MNIST data in csv format. Kaggle.com is recommended.
- Data Exploration & Preprocessing: The whole dataset looks like a sparse matrix. Each row represents a 28x28 picture with 784 pixels(28x28=784). Check label distribution & determnine whether unexpected values existing.
- Data Visualization: Preprocessing data according to each clustering methods' requirements and plot data.
Analysis:
Samples of the MNIST handwritten digits:
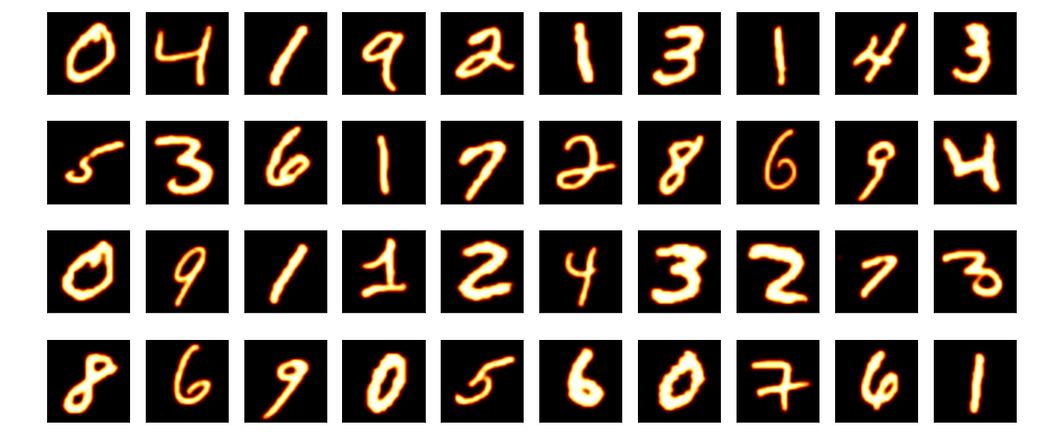
It might look like a color picture, the above digit picture is in fact grayscale with only two colors(black and white). In contrast, pictures in the SVHN dataset are color pictures (not placed here). Generally color would be regarded as noise and transformation is needed to convert color picture to grayscale.
784 pixels are regarded as 784 variables. Use PCA methods to extract eigen values from those 784 variables. The top 40 eigen values are displayed below:

Obviously first few eigen value pictures are quite clear while eigen value pictures latter turn to be more and more obscure.
Get a better sense of how each individual variable contributes to the total variance.
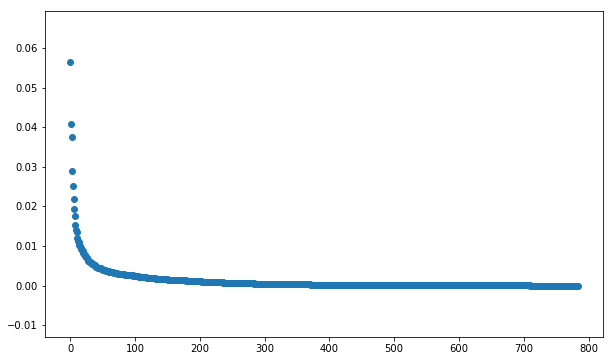
Compared to cumulative variance table:

Clearly, the first 10% variables together contributes to about 80% variance.
Principal Component Analysis
Unsupervised Learning
In order to plot on this two-dimensional website page, only 2 principal components are selected.

There are 10 colors representing 0-9. PCA here with 2 principal componenets couldn't classify each digits since points with different colors are mixed together.
K-Means
Unsupervised Learning
K-Means clustering used here is just for explanation. Assume the MNIST data doesn't have labels and there are only two dimensions(use the two principal components above). Use KMeans to seperate data points according to points' average distance to corresponding cloud center.

The graph looks quite beautiful and well organized but those clusters are actually mistakenly clustered since it is totally different from true labels' distribution in the above PCA graph.
Linear Discriminant Analysis
Supervised Learning
Closed related to PCA, LDA explicitly attempts to model the difference between the classes of data while PCA trys to maximize variance in one dimension.
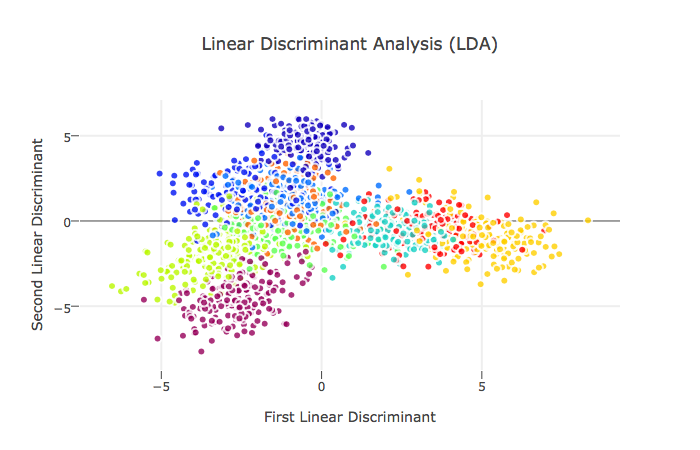
LDA applied here also chooses two linear discriminants(similar to PCA in dimension reduction). The graph shows that most points are clearly clustered.
t-Distributed Stochastic Neighbor Embedding
Supervised Learning
As a non-linear, probability dimension reduction method, t-SNE is particularly well-suited for embedding high-dimensional data into a space of two or three dimensions.
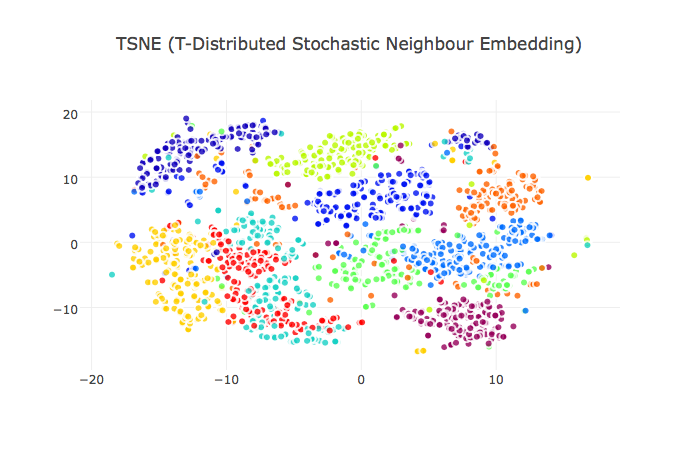
Well seperated clusters and points.
Simple Summary:
KMeans, PCA are unsupervised; LDA and t-SNE are supervised.
KMeans uses distance metrics; PCA cares about dimension variance maximization; LDA seeks to maximize the separation between the different classes by computing the component axes(linear discriminants); t-SNE aims to convert the Euclidean distances between points into conditional probabilities so it is good at non-linear relationship.